Bayesian COVID Probability
Last week, I got a call to come pick up my son from his preschool because he was identified as a close contact of someone that tested positive for COVID-19. Obviously, we were worried and trying to figure out how to keep the rest of the family safe. We also were staring down two weeks during which my son would be at home. Then, the next day, we were notified that the student had originally tested positive via an antigen rapid test, but had tested negative using RT-PCR nasal swab test. Since the RT-PCR test is considered to be much more reliable, the school, following the direction of the state and county health officials, reopened. This got me wondering: What is the chance that the kiddo that tested positive actually had COVID-19? Two pieces of information had been observed: a positive antigen test and a negative PCR test. We also heard that they got tested after showing cold-like symptoms (the comes in again later). I’ve done statistics and probability work for over 10 years now, so I figured that I was just as equipped as anyone else to try and figure this out. First, I had to find all of the information that I could about these tests and how accurate they are and then set up any assumptions that I’m making for the calculation. First, I’m going to use the positivity rate for Monroe county from March 15 through March 21, 2021 (0.8%) as the baseline probability of a person having the SARS-COV-2 coronavirus in their system (Assumption 1). This is probably wrong, but it’s the best I can come up with on short notice. Then I started looking up the sensitivity (true positive rate) and specificity (true negative rate) for both the antigen tests and the PCR test. Since the study of the virus and the tests that have been developed are only about a year old, there really isn’t too much that we can be super sure of. The CDC estimates that
Compared with real-time reverse transcription–polymerase chain reaction (RT-PCR) testing, the Sofia antigen test had a sensitivity of 80.0% and specificity of 98.9% among symptomatic persons; accuracy was lower (sensitivity 41.2% and specificity 98.4%) when used for screening of asymptomatic persons.
I don’t know which antigen test was used, but I will take this as a good proxy for the test used in this case (Assumption 2). Since I heard through the school that the kid that tested positive did have symptoms, I can use the sensitivity and specificity numbers for “symptomatic persons”. Next, I had to look around for a little while to find out more information concerning the sensitivity and specificity of the PCR test. It is considered to be the gold standard in testing, so it is considered the “ground truth” for testing the accuracy of other tests. This article from the Virology Journal uses alternate assays to estimate that the sensitivity of the PCR test to be 90.7%. However, looking for specificity measures on the gold standard test is tricky (how can you know if the test gave you a false negative if the test itself is what is being used to determine truth?). However, this means that I can try plugging in a range of different values for the specificity to see how the results of my projections are impacted. Of course, one of the overarching assumptions that I need to make here is that these numbers, which are based on studies based entirely or almost entirely on adults, will also apply to children (Assumption 3, and it’s a doozy). There’s also the issue that the numbers for the antigen test effectiveness are all based on the PCR test being 100% accurate.
Probability Time
Now I can use some Bayes’ theorem and probability assumptions to at least estimate the quantity that I want to know: What is the probability that someone who tests positive with an antigen test and negative with a PCR test will actually have COVID? We can use Bayes’ theorem to find this probability, held up by the shaky scaffolding of my assumptions. Here’s a quick review on Bayes’ theorem to get everyone up to speed: The probability of an event given observed data is equal to the probability of observing the data given that the event happened times the “prior” probability that the event happens divided by the probability that the observed data happen, independent of the event in question. Or, in math:
\[P(event|data) = \frac{P(data|event)P(event)}{P(data)}\]
Now I’m going to simplify the notation a little bit and represent the even that someone has COVID with the letter \(C\). The data that are observed are represented with the letter \(D\). I can break the data into the two test observations: \(A\) represents a positive antigen test and \(P\) represents a positive PCR test. Overlining one of these letters means the complement to an event, i.e. \(\bar{A}\) represents a negative antigen test. Now I can rewrite Bayes’ theorem above as
\[\begin{align} P(C|D) & = \frac{P(D|C)P(C)}{P(D)}, \end{align}\]
or, splitting the data (\(D\)) into the two events \(A\) and \(\bar{P}\),
\[\begin{align} P(C|A,\bar{P}) & = \frac{P(A \cap \bar{P} | C)P(C)}{P(A \cap \bar{P})}. \end{align}\]
We know, from the statements of the sensitivity and specificity above, that the following are true (or assumed true):
\[\begin{align} P(A|C) & = 0.8, & P(A|\bar{C}) & = 0.011, \\ P(\bar{P}|C) & = 1 - 0.907 = 0.093, & P(C) & = 0.8. \\ \end{align}\]
What we don’t really know anything about is the specificity of the PCR test, that is, \(P(\bar{P}|\bar{C})\). However, we can get pretty close to finding the probability that the kid in question has COVID with one more assumption: That the outcomes from the tests are independent of each other (Assumption 4). This allows us to say that the probability of a positive antigen test and a negative PCR test is just their individual probabilities multiplied together. Now we can plug all of that together to find the closest thing we can get to an answer:
\[\begin{align} P(C|A,\bar{P}) & = \frac{P(A \cap \bar{P} | C)P(C)}{P(A \cap \bar{P})} \\ & = \frac{P(A|C) P(\bar{P}|C)P(C)}{P(A)P(\bar{P})} \\ & = \frac{0.8 \times 0.093 \times 0.008}{(P(A \cap C) + P(A \cap \bar{C})) \times (P(\bar{P} \cap C) + P(\bar{P} \cap \bar{C}))} \\ & = \frac{0.8 \times 0.093 \times 0.008}{(P(A | C) P(C) + P(A | \bar{C}) P(\bar{C})) \times (P(\bar{P}|C) P(C) + P(\bar{P}|\bar{C}) P(\bar{C}))} \\ & = \frac{0.8 \times 0.093 \times 0.008}{(0.8\times 0.008 + 0.01 \times 0.992) \times (0.093 \times 0.008 + P(\bar{P}|\bar{C}) \times 0.992)} \end{align}\]
And now, for a somewhat suitable answer, we can make this probability a function of a given assumed specificity of the PCR test:
COVID_probability <- function(specificity) {
  numerator <- 0.8*0.093*0.008
  denominator <- (0.8*0.008 + 0.01*0.992) * (0.093*0.008 + specificity * 0.992)
  return(numerator / denominator)
}
curve(COVID_probability,from = 0.5, to = 1, xlab = "Specificity", ylab = "COVID Probability")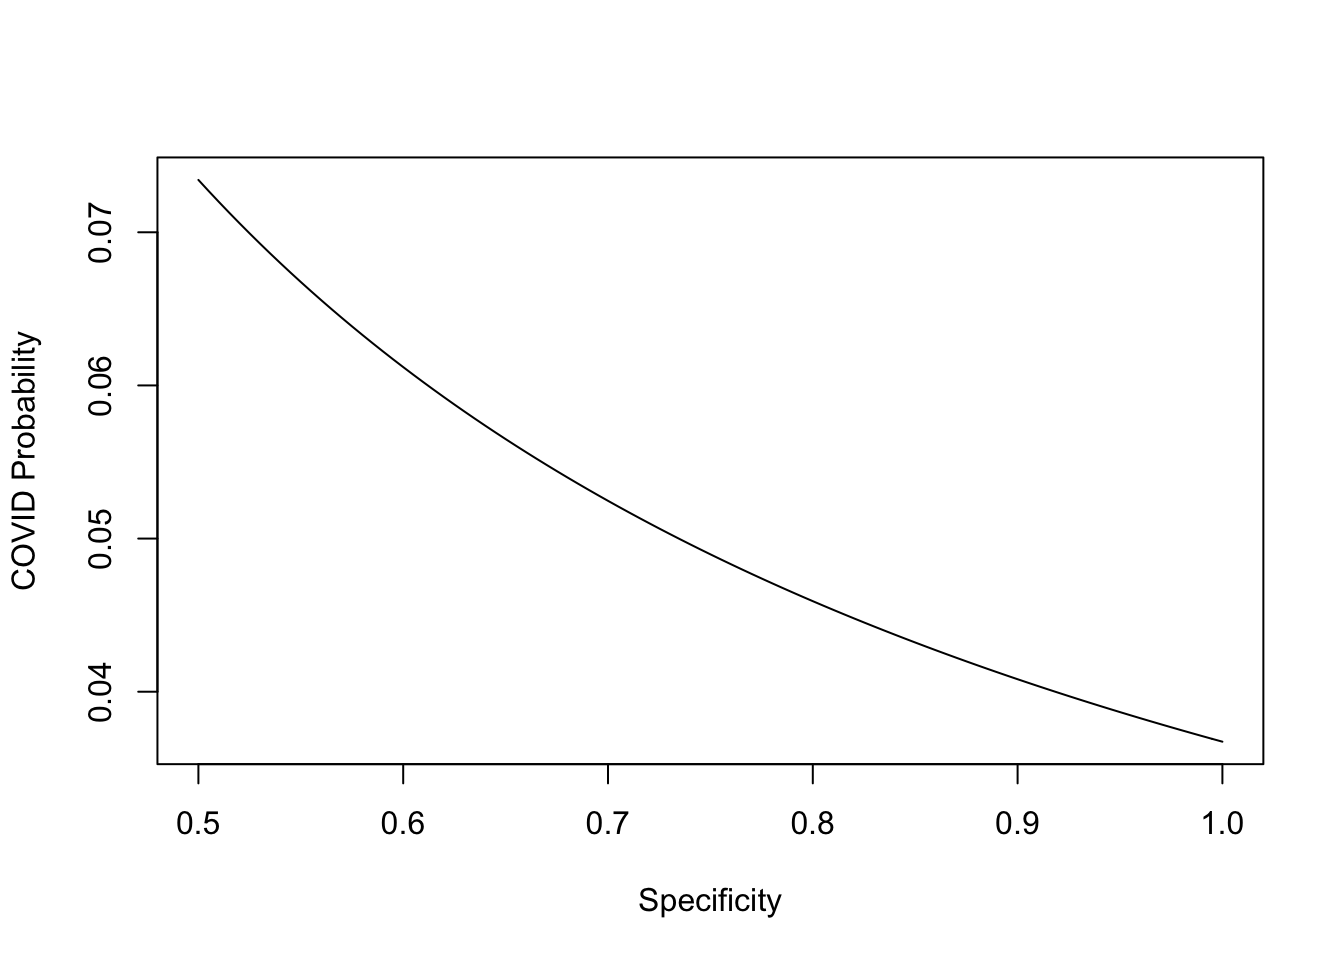
Since a test with a low specificity would be pretty unhelpful, and thus not used, I am only looking at specificity values between 0.5 and 1, though the actual value is probably higher than 0.8 and could be as high as 0.999. This means that the chance that the child that tested positive for the antigen test and negative on the PCR test actually had COVID is somewhere between 3% and 7%. I’ll finish by saying that the school has ordered that that child must stay home for two weeks anyway, but given that they probably did not have COVID, that kids transmit at a much lower rate than adults, and that the kids are all wearing masks and keeping a 6 foot distance in school when possible, I think it is safe for the school to reopen.